Why Tracking Athlete Biomarkers Unlocks Next-Level Endurance
Physiological Mechanisms: Acute vs. Chronic Inflammatory Responses to Training
Systematic inflammation marker tracking for athletes allows competitors and coaches to distinguish between beneficial, acute training adaptations and chronic systemic fatigue. By profiling circulating cytokines, acute-phase proteins, and immune recovery signatures, athletes can objectively calibrate training loads, prevent non-functional overreaching, and optimize physiological recovery timelines.
Exercise induces dynamic immunological shifts. Whenever you complete a high-intensity interval session or a long endurance run, your body initiates a controlled cytokine cascade. Muscle contraction and mechanical strain stimulate the immediate release of interleukin-6 (IL-6) directly from working myocytes.
Unlike the immune activation triggered by infection, exercise-induced IL-6 acts primarily in an energy-sensing and anti-inflammatory capacity. It stimulates downstream production of classic anti-inflammatory cytokines like interleukin-10 (IL-10) and interleukin-1 receptor antagonist (IL-1ra), while simultaneously inhibiting pro-inflammatory drivers like tumor necrosis factor-alpha (TNF-α).
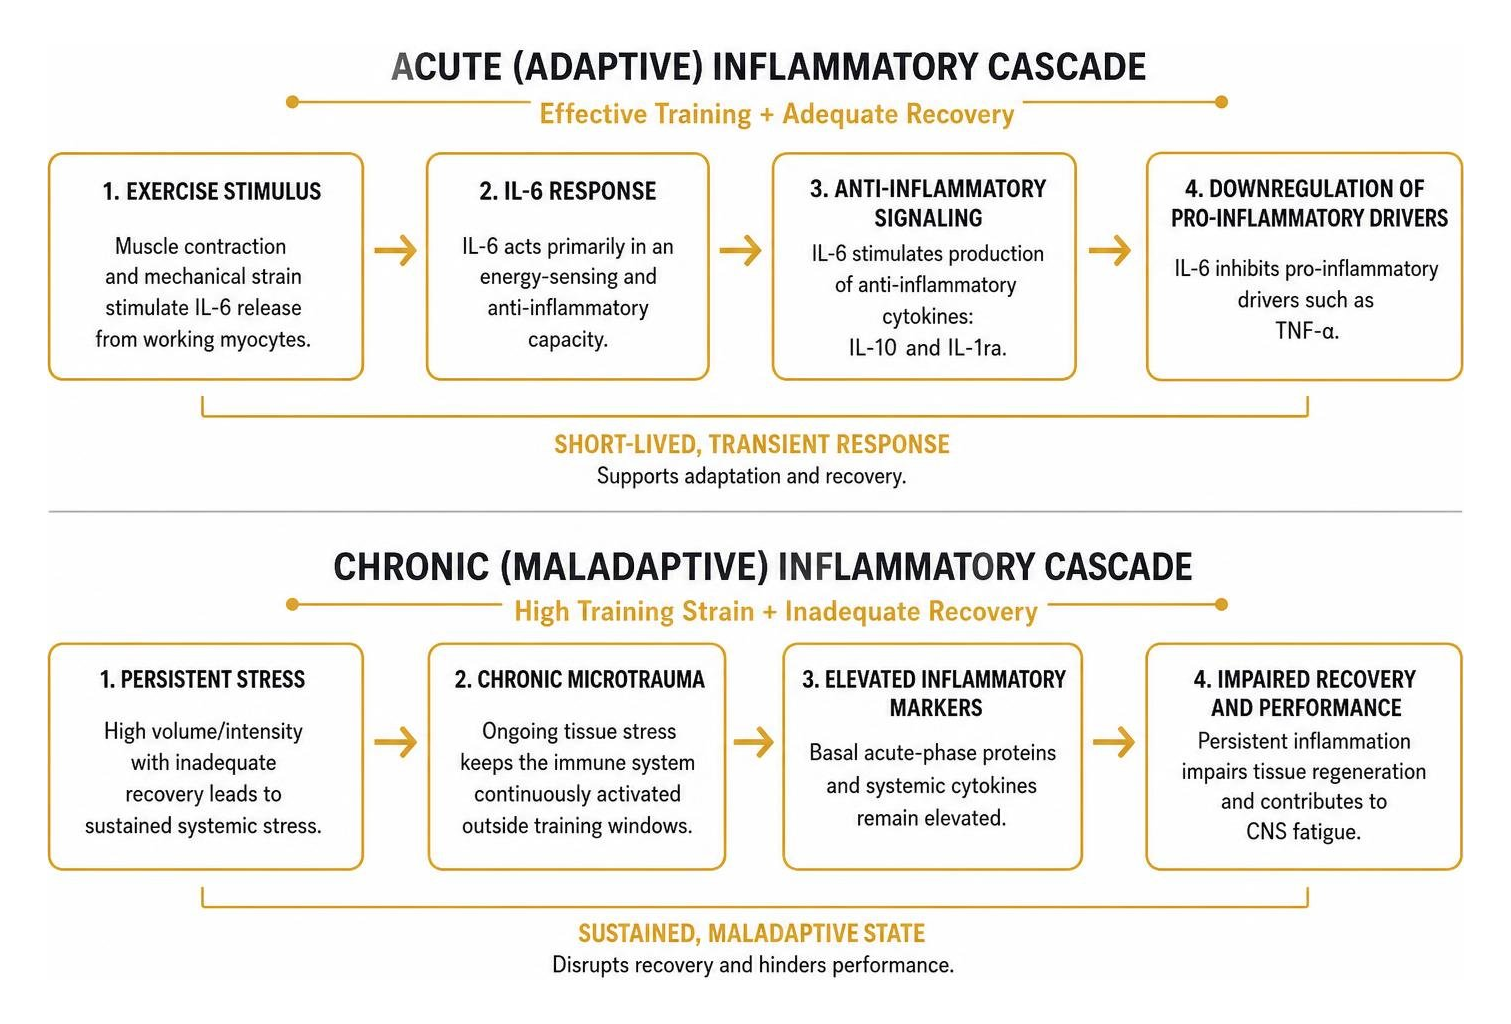
Problems occur when the balance between training strain and tissue repair breaks down. When high-volume or high-intensity workloads are paired with inadequate recovery, this transient cytokine cascade turns into sustained systemic stress. Chronic microtrauma elevates basal acute-phase proteins and systemic cytokines outside of training windows.
Evaluating systemic inflammation blood markers allows us to differentiate between the short-lived immune activation needed for mitochondrial biogenesis and the persistent basal inflammation that impairs tissue regeneration and causes central nervous system fatigue. Scientific research on acute-phase protein kinetics demonstrates that exercise alters circulating acute-phase proteins like C-reactive protein (CRP), lipopolysaccharide-binding protein (LBP), and myeloperoxidase (MPO) in distinct, sex-specific ways across pre-exercise, post-exercise, and resting states.
Biomarker | Acute Response (Adaptive Window) | Chronic Response (Maladaptive Strain) | Primary Physiological Role |
|---|---|---|---|
Interleukin-6 (IL-6) | Rapid 10- to 100-fold spike, clears within 24–48 h | Moderately elevated at rest | Myokine signaling, glycogen mobilization, anti-inflammatory stimulus |
Interleukin-10 (IL-10) | Secondary rise following IL-6 elevation | Depressed or uncoupled from pro-inflammatory signals | Downregulates TNF-α and resolves acute tissue inflammation |
C-Reactive Protein (CRP) | Peaks 24–48 h post-exercise; returns to baseline | Sustained resting elevation (>1.0–3.0 mg/L) | Hepatic acute-phase reactant; systemic inflammation indicator |
IgG Agalactosylation (G0) | Minimal immediate change | Elevated long-term (> baseline ratio) | Pro-inflammatory glycan profile; indicator of biological immune fatigue |
IgG Digalactosylation (G2) | Stable short-term | Elevated following structured training adaptations | Anti-inflammatory glycan profile reflecting positive structural recovery |
Acute-Phase Cytokine Kinetics and Musculoskeletal Stress
The speed of cytokine release reflects the nature of your training load. Peak IL-6 concentrations occur at the end of hard physical efforts, correlating with duration, intensity, and active muscle mass. It is often accompanied by transient rises in interleukin-1 beta (IL-1β), a pro-inflammatory cytokine linked to mechanical microtrauma in muscle fibers.
When monitoring recovery kinetics, we evaluate these cytokine fluctuations alongside muscle breakdown indicators. Utilizing a creatine kinase blood test provides direct visibility into structural sarcolemmal disruption. While creatine kinase (CK) peaks 24 to 72 hours post-exercise depending on eccentric volume, acute cytokine shifts happen within minutes to hours. Tracking both markers clarifies whether elevated systemic inflammation is driven by localized muscle damage or systemic, neuroendocrine fatigue.
Basal Immune Shifts and IgG N-Glycosylation Profiling
While cytokines provide a real-time snapshot of physiological stress, they fluctuate rapidly throughout the day. For a stable, long-term assessment of systemic immune health, we evaluate the N-glycosylation profiles of Immunoglobulin G (IgG) antibodies.
IgG molecules carry complex carbohydrate chains (glycans) attached to their Fc regions. The composition of these glycans dictates whether the antibody exhibits pro-inflammatory or anti-inflammatory properties:
Agalactosylation (G0): Glycans lacking terminal galactose residues promote downstream immune activation and are elevated during systemic inflammatory states and accelerated biological aging.
Digalactosylation (G2) and Monosialylation (S1): Glycans with two terminal galactose units or added sialic acid units promote anti-inflammatory signaling and immune stabilization.
(Tijardović et al., 2019) Longitudinal research reveals that six weeks of repeated sprint training followed by a four-week recovery period produces marked anti-inflammatory changes in IgG N-glycosylation, including significant decreases in agalactosylated glycans (G0) alongside increases in digalactosylated (G2) and monosialylated structures. Tracking IgG glycan shifts provides an objective method for confirming structural recovery and systemic adaptation during intense training blocks.
The Science of Inflammation Marker Tracking Athletes in Modern Endurance Sport
Recent breakthroughs in high-plex proteomics have changed how we assess athlete recovery. Historically, exercise scientists were limited to analyzing a handful of systemic markers, like CRP or IL-6, via standard venipuncture. Today, platforms such as the NULISAseq 250-plex panel allow for the simultaneous quantification of hundreds of low-abundance cytokines, chemokines, and structural proteins from micro-volume samples.
During sustained endurance events like half-marathons, research shows that athletes exhibit a 3.9-fold greater magnitude of inflammatory proteomic change compared to baseline variability in resting controls. Capturing these multi-protein signatures reveals the biological cost of high-intensity efforts across multiple organ systems. For instance, scientific research on match load and C-reactive protein shows that serum CRP correlates strongly with high-speed sprint efforts in competitive matches ($r = 0.71\text{--}0.79$, $R^2 = 0.624$), making it an accurate indicator of internal sprint load.
Implementing Dried Blood Spot Microsampling for Inflammation Marker Tracking Athletes
Standard venous blood draws can be challenging to coordinate around intense training schedules. Dried blood spot (DBS) microsampling offers a field-compatible, minimally invasive alternative. Athletes collect small capillary blood samples from a finger-prick onto specialized collection cards. Once dried, samples can be stored with desiccant and transported for laboratory analysis.
The NULISAseq 250-plex Inflammation Panel demonstrates a 92.4% detectability rate for target proteins above the limit of detection in DBS specimens. When exploring how to test for inflammation at home, athletes can use validated micro-sampling tools to capture high-resolution proteomic data across multi-day stage races or congested competition schedules without laboratory visits.
Measuring Biological Inflammation Age and Proteomic Shifts
Advanced proteomic mapping makes it possible to calculate an athlete's biological "Inflammation Age." Derived from Lasso regression models trained on age-associated inflammatory proteins, this composite score assesses the functional age of your circulating immune system.
Following intense endurance events like a half-marathon, Inflammation Age has been shown to increase transiently by an average of 3.1 years (95% CI: -1.2, 3.1) in competitive athletes, compared to just 0.6 years in controls. This transient shift reflects acute systemic immune activation. In well-recovered athletes, Inflammation Age returns to baseline within 48 to 96 hours. If this metric stays elevated, it points to incomplete systemic recovery and helps coaches adjust upcoming workouts before cumulative fatigue sets in.
Novel and Multi-Omic Biomarkers for Precision Load Monitoring
High-resolution proteomics has identified several novel proteins that change during endurance exercise:
TAFA5 (Neurokine): A neuro-inflammatory chemokine involved in central nervous system response to sustained metabolic exertion.
MMP3 (Matrix Metalloproteinase-3): A tissue-remodeling enzyme that rises during microvascular and extracellular matrix breakdown, marking connective tissue strain.
SCG2 (Secretogranin II): A neuroendocrine precursor peptide reflecting sympathetic nervous system activation and adrenal load.
VEGFD and TNFRSF8: Vascular endothelial growth factors and immune receptor superfamilies that modulate microvascular permeability and lymphocyte activation during prolonged aerobic work.

By monitoring these proteins alongside classic indicators, you can look beyond generic fatigue and pinpoint whether stress is rooted in connective tissue strain, autonomic disruption, or muscular exhaustion. Regular profiling of performance biomarkers turns training from a guessing game into an objective, data-informed process. For example, scientific research on collegiate athlete biomarker monitoring tracked 92 blood markers over a 12-week season in NCAA Division I soccer players, observing significant shifts in endocrine, immune, hepatic, and muscle markers that highlighted subclinical fatigue well before performance dropped.
Individualized Immune Profiles and Non-Linear Biomarker Responses
Biomarker responses vary from person to person. When monitoring inflammatory dynamics during high-volume training blocks, athletes exhibit distinct recovery timelines:
Platelet-Derived Growth Factor Subunit B (PDGFB): Some athletes show immediate mid-effort rises in PDGFB that normalize within 24 hours, while others show a delayed elevation occurring up to seven days post-exercise, indicating prolonged vascular repair.
Cathepsin S (CTSS): A lysosomal enzyme involved in antigen presentation that varies based on training status and baseline immune tone.
The Fischer Ratio (BCAA to Aromatic Amino Acids): A valuable metabolic indicator for central fatigue risk. Female athletes frequently present with lower baseline BCAA concentrations and Fischer ratios compared to males, altering central fatigue thresholds and amino acid oxidation rates during extended efforts.
Because individual physiology differs, athlete monitoring must focus on deviations from personal baseline trends rather than static, population-wide reference ranges.
Intersecting Endocrine, Hepatic, and Muscle Damage Markers
Inflammation does not operate in isolation. It interacts directly with your endocrine system and metabolic organs:
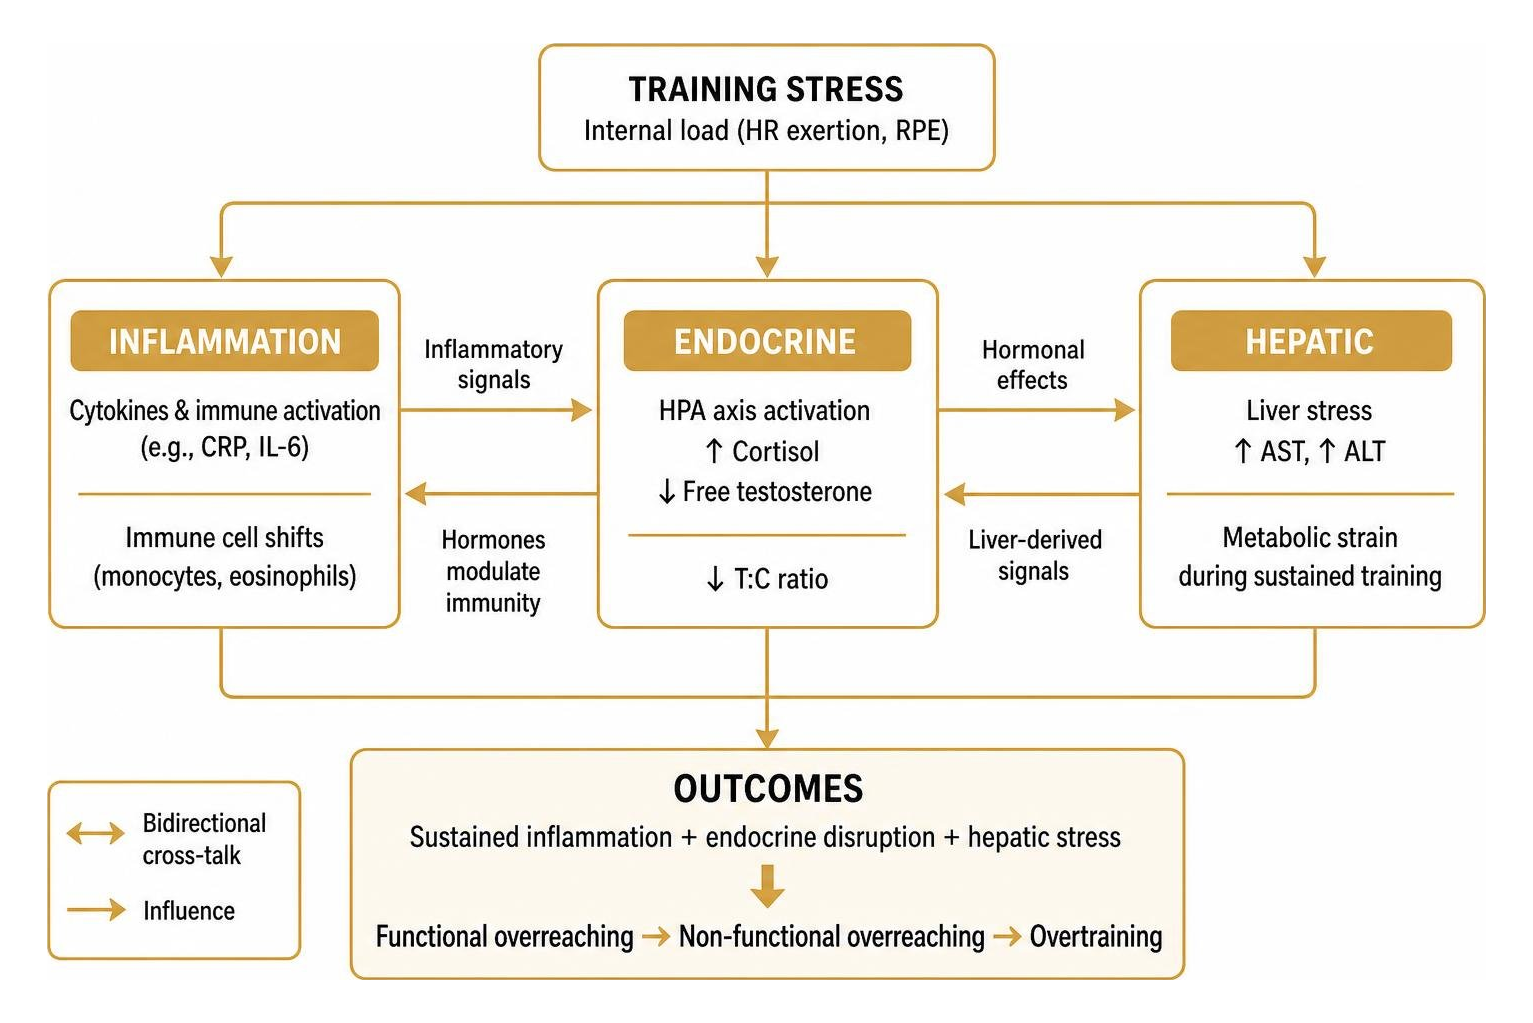
During sustained training blocks, internal load (monitored via heart rate exertion and session RPE) links directly to increases in hepatic transaminases (AST, ALT) alongside immune cell shifts (monocytes, eosinophils), even without clinical pathology.
When muscle breakdown and inflammatory cytokines remain high, the hypothalamic-pituitary-adrenal (HPA) axis elevates basal cortisol and lowers free testosterone. A persistently depressed testosterone-to-cortisol (T:C) ratio paired with unresolving CRP or IL-6 elevation is a reliable signature of functional overreaching progressing toward non-functional overreaching or overtraining syndrome.
Step-by-Step Protocol: How to Implement Biomarker Periodization
To use biomarker monitoring effectively, coordinate testing cadences with specific phases of your macrocycle. Structuring your blood profiling alongside volume shifts, tapers, and race peaks ensures every data point guides actionable adjustments to training loads and recovery interventions.
Training Phase | Primary Biomarker Targets | Sampling Modality | Testing Frequency | Primary Strategic Action |
|---|---|---|---|---|
Phase 1: Baseline & Calibration | IgG Glycans, CRP, Complete Blood Count, Comprehensive Metabolic Panel, Free T:C | Venous draw or comprehensive DBS panel | Once pre-season (fasted, rested) | Establish individual baseline; identify underlying nutritional or endocrine deficits |
Phase 2: High-Volume Overload | CRP, IL-6, Creatine Kinase, AST/ALT, Ferritin | Micro-sampling / DBS capillary | Bi-weekly (36 h post-hardest session) | Monitor adaptive tolerance; prevent systemic inflammation spillover |
Phase 3: Taper & Peak Race | Inflammation Age, IL-6, Cortisol, Urea / Total Protein | Targeted DBS micro-panel | 7–10 days prior to peak event | Verify systemic inflammation resolution and full central readiness |
Phase 4: Post-Race Recovery | CRP, IgG N-Glycosylation, PDGFB, MMP3 | DBS or clinic venous draw | Day 3 post-race and Day 14 post-race | Direct return-to-train timeline and tissue remodeling protocols |
Our comprehensive biomarker training plan guide 2026 explains how to integrate multi-omic profiling into daily athletic routines.
Phase 1: Establishing Baselines and Seasonal Calibration
Before beginning an intense training block, establish your physiological baseline:
Standardize Timing: Collect all baseline samples between 07:00 and 08:30 AM in a fully rested, overnight-fasted state.
Control Pre-Test Activity: Avoid heavy physical exertion for at least 36 to 48 hours prior to baseline sampling to ensure acute myokines have cleared.
Screen Multi-System Panels: Complete a broad screen covering immune indices, endocrine baselines, micronutrient stores (including 25-hydroxy vitamin D and ferritin), and baseline IgG glycan distributions.
Define Normal Ranges: Document your personal resting ranges for CRP, leukocyte counts, and creatine kinase rather than relying entirely on clinical reference intervals.
Phase 2: In-Season Load Modulation and Tactical Biomarker Tracking
During high-volume or competition phases, use targeted testing to guide tactical adjustments:
Correlate with External Metrics: Pair weekly or bi-weekly CRP and CK checks with external training data (such as GPS sprint volumes, power output, and accelerometry). If external volume is steady but inflammatory markers rise continuously over two weeks, reduce high-velocity training volume by 20–30%.
Adjust Fueling Strategies: Align test results with personalized biomarker-based nutrition plans. If acute-phase markers and muscle damage indicators remain elevated, increasing dietary polyphenols, omega-3 fatty acids, and targeted amino acids can support tissue repair.
Refine Recovery Protocols: When biomarkers indicate elevated systemic stress, prioritize sleep extension and adjust training schedules to support physiological recovery.
Frequently Asked Questions About Athlete Biomarker Tracking
How quickly do inflammatory markers return to baseline after an endurance event?
Recovery timelines vary by biomarker:
IL-6: Returns to near-baseline within 24 to 48 hours following a half-marathon or marathon, provided post-exercise carbohydrate intake is adequate.
CRP: Peaks between 24 and 48 hours post-race and typically normalizes by day 4 to 6.
IgG N-Glycosylation: Structural glycan adaptations reflect a longer biological window, settling over two to four weeks of structured recovery.
Active Recovery: Low-intensity active recovery (Zone 1 spinning or swimming) accelerates blood flow and cytokine clearance compared to complete passive rest.
What is the advantage of dried blood spot proteomics over standard venipuncture?
Dried blood spot (DBS) microsampling offers three major benefits for active athletes:
Field Convenience: Collect finger-prick blood at home, in team hotels, or at trackside without clinical staff or centrifuge equipment.
Stability: Target proteins dried on filter paper with desiccant remain stable at room temperature or standard refrigeration during transit.
High-Plex Detection: Advanced analytical platforms like NULISAseq can detect over 200 low-abundance cytokines and tissue-remodeling proteins from less than 10 microliters of capillary blood with a 92.4% target detectability rate.
If you are looking to perform periodic inflammation testing, DBS microsampling balances clinical accuracy with real-world practicality.
How can athletes distinguish between functional overreaching and maladaptive inflammation?
The difference lies in marker duration and endocrine balance:
Functional Overreaching: Marked by temporary spikes in IL-6, CRP, and creatine kinase that resolve within 48 to 72 hours of deloading. Resting morning heart rate variability (HRV) recovers quickly, and performance rebounds above baseline.
Maladaptive (Chronic) Inflammation: Characterized by sustained resting CRP elevation (>1.5–3.0 mg/L), elevated baseline Inflammation Age, high agalactosylated IgG glycans (G0), and an uncoupled testosterone-to-cortisol ratio. These physiological shifts are typically accompanied by persistent fatigue and unexpected drops in athletic performance.
Conclusion
Biomarker tracking removes the guesswork from athletic performance, recovery, and longevity. By observing how your immune system responds to acute training stress—and verifying that basal inflammation resolves over time—you can train with higher precision, avoid overtraining, and extend your competitive lifespan.
At Longevity Athlete, we provide precision-performance wellness consulting for disciplined athletes. We use personalized biomarker testing and data-driven protocols to optimize longevity and athletic output. Whether you are an elite competitor or a dedicated amateur, our programs meet your specific operational needs:
The Signature Plan: A structured, self-guided group program designed for athletes looking to systematically track and interpret baseline health metrics.
The Gold and Platinum Plans: Fully customized programs that create individualized lifestyle, training, and recovery protocols built entirely around your unique multi-omic biomarker data.
Ready to see how precision biomarker tracking can transform your training? Visit our main platform to explore our complete suite of testing solutions and consultation programs. You can also read through our athlete performance blog, discover our full consulting services, or learn more about our clinical philosophy.
References
Tijardović M, Marijančević D, Bok D, Kifer D, Lauc G, Gornik O, Keser T. "Intense Physical Exercise Induces an Anti-inflammatory Change in IgG N-Glycosylation Profile.." Frontiers in physiology, 2019. PMCID PMC6933519.